What Is PCR?
PCR (Put-Call Ratio) is an options market indicator that shows whether market participants are buying more Put options or more Call options. In simple terms, it converts overall market sentiment into a single number — without needing to look at a price chart at all. That's why traders check Nifty PCR and live PCR data every day before the market opens.
When traders are bearish (expecting the market to fall), they buy or write more Put options. When they are bullish, Call option activity increases. PCR turns this activity into a simple ratio that any trader can check at a glance.
PCR range — illustrative scale for understanding sentiment zones. Not a live data feed or trading signal.
How to Calculate PCR
The formula for PCR is simple:
Some traders also use Volume-based PCR (Put Volume ÷ Call Volume), which is more responsive for intraday sentiment, while OI-based PCR is more stable and better suited to swing trading.
You don't need to calculate this data manually — live PCR is available for free on the NSE official Option Chain page, both index-wise and stock-wise.
Why PCR Matters in Trading
PCR is a quick way to understand the overall mood of the market. When PCR is high, it means traders are either bearish or hedging their existing positions. When PCR is low, it means bullish activity is dominant in the market.
Another major use of PCR is identifying market reversals. Extremely high or extremely low PCR values often hint at overbought or oversold conditions. Professional traders never use PCR alone — they combine it with price action and other signals to confirm a trend reversal.
How to Interpret PCR
Interpreting the PCR number correctly is the real skill. Here's a commonly followed reference table:
| PCR Range | Traditional Reading | Contrarian Reading |
|---|---|---|
| Below 0.7 | Bullish sentiment (Calls dominate) | Overbought — reversal down possible |
| 0.7 – 1.0 | Neutral to mildly bullish | Balanced market, no strong bias |
| Around 1.0 | Balanced sentiment | Watch for breakout direction |
| Above 1.3 | Bearish sentiment (Puts dominate) | Oversold — reversal up possible |
Illustrative PCR gauge — needle position shows a sample reading, not live market data.
What Does PCR 0.87, 0.89 or 1.07 Mean?
Traders often get confused when they see exact PCR values. Some common readings:
- PCR 0.87 or 0.89: This shows balanced-to-mildly-cautious sentiment. It doesn't give a direct buy or sell signal on its own — you need to compare it with support-resistance, price action, volume and option chain data.
- PCR 1.07 (above 1.0): This means put open interest is higher than call open interest. It can indicate bearish sentiment or hedging activity. But a very high PCR can also sometimes signal an oversold or reversal zone.
- PCR 0.64 or 0.69 (below 0.7): Call activity is higher than put activity. This can indicate bullish sentiment, but should be confirmed with trend and price action.
How PCR Works
PCR is based on put and call activity in the options market. As open interest changes, the PCR number moves accordingly — if call OI increases faster, PCR moves down, and if put OI increases faster, PCR moves up. Traders track this movement to gauge market sentiment, potential support-resistance levels, and shifts in sentiment.
PCR and Support–Resistance
PCR also helps identify important support and resistance levels. High put open interest at a particular strike price shows strong support, while high call open interest shows strong resistance. By tracking PCR changes near these levels, traders can anticipate potential breakouts or reversals.
Nifty PCR vs Stock PCR
Due to high liquidity, PCR is most commonly used on index options — such as Nifty PCR and Bank Nifty PCR. Stock-specific PCR is also quite useful, but you should always check that stock's volume and liquidity, otherwise there's a risk of a false signal.
It's also helpful to cross-check PCR against global cues — such as Gift Nifty's overnight trend, Dow Jones futures, and India VIX levels. If global markets are weak and India VIX is rising, even a "bullish" looking PCR should be read cautiously.
How to Read Market Direction from PCR
Simply looking at one number and calling the market "bullish" or "bearish" would be wrong. To determine market direction, you need to cross-check PCR against the following:
- Look at the absolute PCR valueExample: PCR = 1.5. By the traditional reading this is puts-heavy, so it may show a "BULLISH" (contrarian) tag — as seen on platforms like Sensibull.
- Track the PCR trendIs PCR rising or falling since the start of the day? A rising PCR (0.9 to 1.5) shows shifting sentiment — this matters more than a static number alone.
- Compare with Max PainMax Pain is the strike where option writers make maximum profit at expiry — price often gets pulled toward Max Pain near expiry. If PCR shows "Bullish" but Max Pain is lower, that's a conflicting signal.
- If signals conflict, waitWhen PCR and Max Pain disagree with each other, don't take a trade immediately. Wait for confirmation from price action — a candle close, a CPR level break, or a volume spike.
- Also note ATM IVIf ATM IV is also rising, uncertainty is increasing in the market — keep your position size small during this time.
Market direction decision flow — PCR alone is never the final trigger.
Step-by-Step PCR Trading Strategy
Here's a basic framework for using PCR in a structured way in your own trading:
- Check the daily PCR trendBefore the market opens, check the current PCR and its trend over the last 3–5 days on the NSE Option Chain — is it rising or falling.
- Identify extreme zonesIf PCR is above 1.3 or below 0.7, note it as a potential reversal zone — don't trade yet, just add it to your watchlist.
- Get confirmation from price actionPCR is not a standalone signal. Watch what price is doing around CPR levels (Pivot, TC, BC) in that extreme zone.
- Wait for an entry triggerOnly enter once the PCR extreme and CPR level both align and price confirms direction with a clear candle.
- Fix your stop-loss and target in advanceDecide your stop-loss and target before entry — never decide emotionally in the middle of a trade.
PCR + CPR Combo Strategy
At Trading Direction, we never use PCR standalone — we combine it with our CPR Brahmastra Strategy. The reason is simple: PCR tells you the sentiment, CPR tells you the exact price level where that sentiment is likely to play out.
When PCR shows an extreme zone AND price is near the Top Central (TC) or Bottom Central (BC) of CPR, the probability becomes much stronger — because two independent indicators are confirming the same direction.
Real Trade Example: Why PCR Alone Fails
What we've discussed so far is theory. In live markets, the biggest limitation of PCR is something you can't fully grasp just by looking at a single chart or screenshot. So this time, I'm showing my own actual observation and a real backtested example of why PCR alone — especially for catching an intraday trend reversal — is not reliable.
Video: The same example is explained step-by-step on the live chart.
Same Day, Two Different Expiries — Two Opposite PCR Tags
These are actual Sensibull screenshots for NIFTY, taken on the same trading day. Both screenshots are for the same underlying, same day — only the expiry date is different. See the difference for yourself:
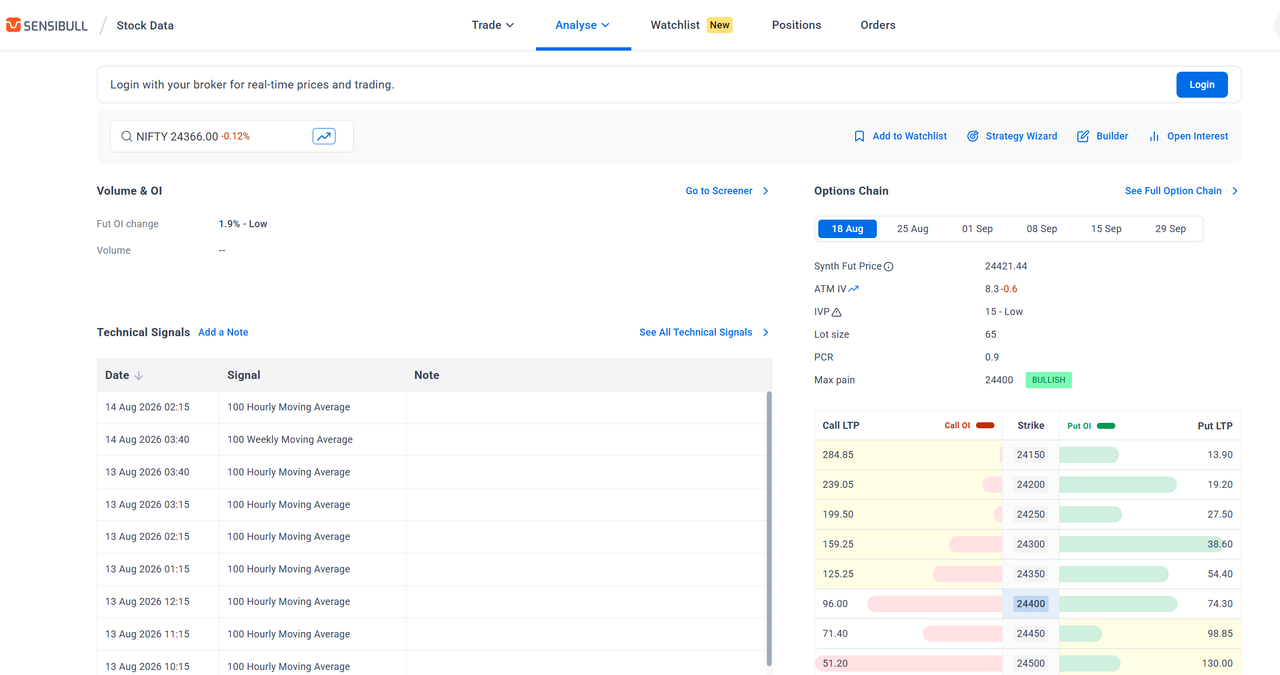
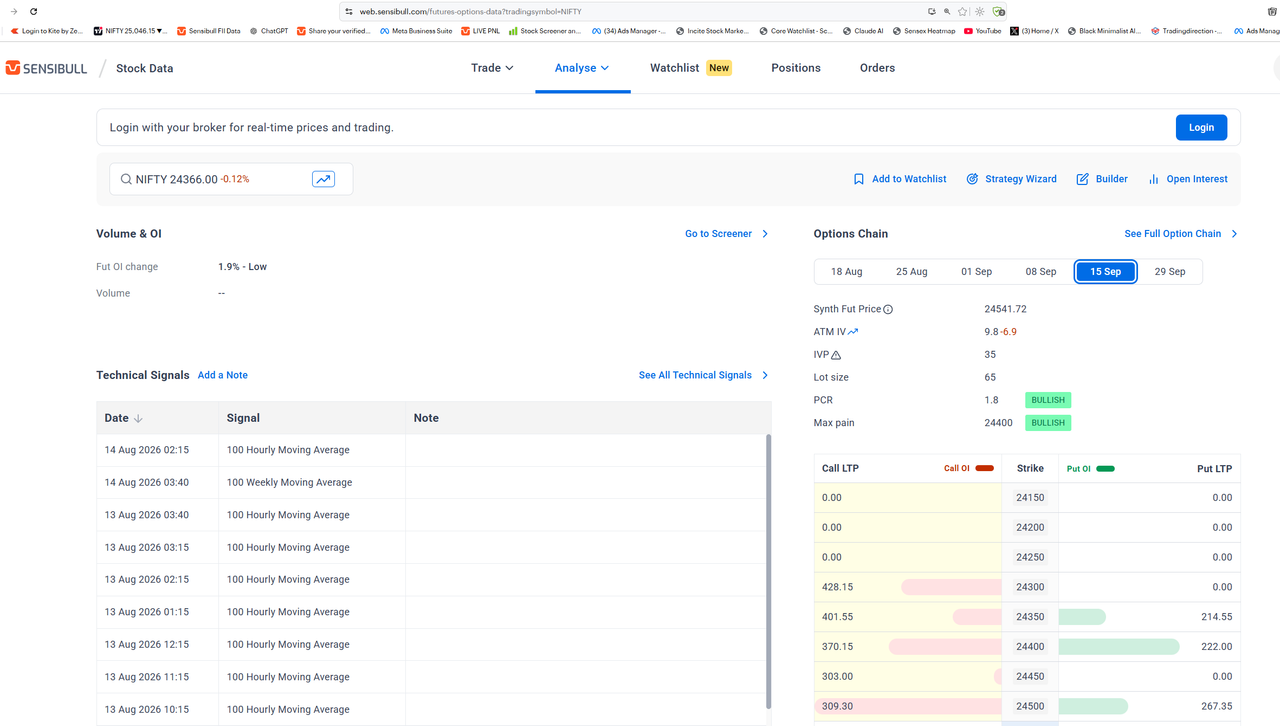
This is the real problem. Far-month expiries have lower liquidity, and large hedgers/institutions write their long-term Put protection there — this distorts the far-month PCR number. If a beginner sees just the "BULLISH" tag and takes an intraday or short-term trade on it, they're making a decision based on the wrong expiry's data.
OI Change Data — What's More Reliable Than a Single PCR Number
Instead of a static PCR number, I find it far more useful to watch the OI Change data through the day — this shows which strike saw Call OI and Put OI build up and when, rather than just a single end-of-moment ratio.
On the day of this example, Put OI was noticeably stronger early in the session on the lower strikes (23,900–24,200), but as the day progressed, Call OI built up heavily on the resistance strikes (24,350–25,000). A single static PCR number never shows this intraday shift — only the full-day OI change data does. At the same time, price on both the Daily and Weekly CPR was consolidating right around the Bottom Central (BC) and Pivot — confirming that the real decision level that day was CPR, not PCR. PCR was only supporting context, not the primary trigger.
What to Take Away From This
- Use only the near-week expiry PCR for intraday or short-term decisions — far-month PCR serves a different purpose.
- Watch the OI Change data instead of a static PCR number — it shows where and when OI is building, not just a single snapshot.
- Always keep CPR levels as the primary trigger, and use PCR only as confirmation/context — as shown in this example, price reacted around the CPR BC/Pivot, not around any PCR number.
- If two expiry dates show mismatched PCR, don't trust either — wait and confirm with price action.
Advantages of Using PCR
- Easy to calculate and understand.
- Helps identify market sentiment without looking at a price chart.
- Extreme readings can give an early hint of potential reversal zones.
- Useful for cross-verifying support and resistance levels against option chain data.
- Free and available in real time — on NSE, Sensibull and most broker platforms.
Risk Management Rules
No strategy — whether PCR or CPR — is useful unless risk management is strong. Some non-negotiable rules:
- 2% Drawdown Rule: Never risk more than 2% of your total trading capital on any single trade.
- Trailing Stop-Loss: Trail your stop-loss as the trade moves into profit, to protect your gains.
- No Revenge Trading: Don't jump into another trade right after a loss to try to recover it.
- Position Sizing: Decide lot size based on the option premium, not just how much profit you'd like to make.
Common Mistakes Traders Make
- Treating PCR as a standalone signal and trading without price action confirmation.
- Making a decision based on a single day's PCR — ignoring the trend.
- Mixing up stock-specific PCR and Index PCR.
- Entering immediately on seeing an extreme PCR, without candle-close confirmation.
- Skipping risk management and trading purely on the "signal."
Learn the PCR + CPR Strategy Live
Join Anil's free Sunday webinar to learn it step by step.
Join Free WebinarFAQ
PCR stands for Put-Call Ratio. It is an options market indicator calculated by dividing the total Open Interest (or volume) of Put options by the total Open Interest (or volume) of Call options.
The PCR ratio shows the relationship between put option activity and call option activity. A higher PCR generally indicates more put activity, while a lower PCR indicates more call activity.
A PCR above 1 means Put Open Interest is higher than Call Open Interest. Traditionally this is read as bearish sentiment, but contrarian traders treat it as an oversold zone and a possible signal of a bullish reversal.
A PCR near 0.87 or 0.89 shows balanced-to-mildly-cautious sentiment. A PCR of 1.07, being above 1.0, can indicate bearish sentiment or hedging activity. In both cases, confirm with trend and price action.
Nifty PCR and Bank Nifty PCR are considered more reliable due to high liquidity. Stock-specific PCR is also useful, but check volume and liquidity, otherwise it can give a false signal.
No. PCR is a sentiment indicator, not a standalone signal. It should be combined with CPR (Central Pivot Range), price action and proper risk management to get a reliable entry-exit setup.
Live PCR data is available for free on NSE's official website (nseindia.com) under the Option Chain section. Sensibull, Zerodha Kite, Upstox and Angel One also show this data.
The concept of PCR itself is simple — it's a ratio. The hard part is interpreting it correctly in context (trend, CPR levels, IV), which comes with practice and guided learning.
No, no trading strategy guarantees profit. PCR is a probability-based sentiment tool. Trading Direction provides this content for educational purposes only, not investment advice.
Trading Direction is an educational platform. The information in this article is for educational purposes only and does not constitute advice to buy or sell any security. Trading in the securities market carries financial risk; past performance or illustrative examples do not guarantee future results. Please do your own research and/or consult a certified financial advisor.