Free Narrow CPR Stock Scanner: Daily Shortlist for Breakout Trades
Narrow CPR · Stock Scanner
There are no items in your cart
Add More
Add More
| Item Details | Price | ||
|---|---|---|---|
CPR vs Price Action vs RSI vs VWAP vs EMA vs MACD — a complete, honest scorecard for Indian intraday options traders, with the exact 15-min → 5-min → 2-min execution framework used inside Trading Direction.
Every new options trader searches for one thing: the single best indicator that prints accurate signals. The truth is less exciting but far more useful — no indicator wins alone. The real skill lies in knowing which tool does which job, in which market condition, on which timeframe. This guide benchmarks the 10 indicators every intraday options trader keeps hearing about — CPR, Price Action, RSI Divergence, Support & Resistance, Volume, VWAP, EMA, MACD, Smart Money Concepts, and Moving Average Crossover — across 15 real-world parameters, then tells you exactly which combination we teach and use at Trading Direction.
Speed matters enormously in options trading because premiums decay every minute. An indicator that reacts late can mean paying up for an option after the real move is already priced in. Here's how the 10 indicators stack up on raw reaction speed:
Important caveat we always repeat in the Sunday CPR Brahmastra class: faster is not automatically better. Fast indicators like 2-minute RSI or raw price action can throw more false signals in choppy, gap-heavy sessions. Speed must always be paired with a filter — which is exactly why confluence (Section 8) matters more than any single tool.
For options buyers specifically, leaning too heavily on lagging tools is expensive — by the time an EMA crossover confirms, a chunk of the premium expansion is already gone. That's why CPR and Price Action anchor almost every Trading Direction setup.
Here is the full side-by-side comparison across the parameters that actually decide whether a setup is tradeable — not just "accurate."
| Indicator | Type | Best Market | Entry Timing | Stop-Loss Clarity | False Signal Risk | Learning Curve |
|---|---|---|---|---|---|---|
| CPR | Leading | Range, Reversal, Breakout, Gap Open | Early | High (beyond level) | Low (with confluence) | Easy–Medium |
| Price Action | Leading | All conditions | Early | High (swing high/low) | Medium | Medium–Advanced |
| RSI Divergence | Leading | Reversal, Range | Early | Medium | Medium (alone: high) | Easy |
| Volume | Leading/Confirming | Breakout, Gap Open | Confirmation | Medium | Low (as filter) | Medium |
| Support & Resistance | Leading | Range, Reversal | Early | Medium (subjective zones) | Medium | Medium |
| Smart Money Concept | Leading | Reversal, Structure shifts | Early | High (liquidity/structure) | Medium | Advanced |
| VWAP | Confirming | Trend, Institutional reference | Confirmation | Medium (rejection based) | Low–Medium | Easy–Medium |
| EMA | Lagging | Strong trend | Late | Medium (structure around EMA) | Medium | Easy |
| MACD | Lagging | Trending, momentum confirmation | Late | Low | High in sideways markets | Easy |
| MA Crossover | Lagging | Strong trend | Late | Low | High | Easy |
This is our working rank order specifically for intraday options buying and selling — not for long-term investing or pure equity trend-following.
The backbone of the Trading Direction methodology. CPR gives objective, pre-calculated levels before the market even opens — ideal for options traders who need to know where price is likely to react, expand, or reverse, well before the candle forms.
Read the full framework in the book: Trading Direction — by Anil Hanegave.
The fastest possible trigger — candle structure, swing points, and rejection wicks tell you what's happening right now, with zero lag.
Excellent early-warning tool for exhaustion and reversal — particularly useful for options sellers looking to fade an overextended move.
See this exact confluence used in a real trade: CPR Brahmastra BTST Put Option — Trade Case Study.
The participation check. A breakout without volume is a trap waiting to happen — this is what separates real moves from stop-hunts.
The institutional average price for the day — useful as a real-time bias filter and a natural rejection/support zone during trend days.
Classic horizontal zones remain relevant, especially layered with CPR levels for extra confluence.
Order blocks, liquidity sweeps, and fair value gaps offer a powerful structural lens — but the learning curve is steep for beginners.
A dependable trend filter, but it will always confirm the move after it has already begun — costly in fast-decaying options premiums.
A momentum-confirmation tool best used as a filter, not a trigger, for options entries.
The slowest tool on this list — useful for positional trend confirmation, but generally the weakest fit for fast intraday options decisions.
| Trading Question | Best Tool(s) |
|---|---|
| Where can price react? | CPR + Support/Resistance |
| What is the market direction? | CPR + Higher Timeframe Structure |
| Is a reversal possible? | RSI Divergence + Price Action |
| Is momentum strong? | RSI + Price Structure |
| Is participation genuine? | Volume |
| What is intraday fair value? | VWAP |
| Is the trend continuing? | EMA + Price Action |
| Where should I enter? | 2-Minute Price Action |
| Where should I confirm? | 5-Minute Chart |
| What's the bigger direction? | 15-Minute Chart |
| Where should I exit? | CPR Targets + Structure + Momentum |
The decision sequence we teach every Sunday in the CPR Brahmastra live class:
| Step | Tool | Role |
|---|---|---|
| 1 | CPR | Location — where price is likely to react |
| 2 | Price Action | Trigger — the actual entry signal |
| 3 | RSI | Reversal & strength check |
| 4 | Volume | Participation confirmation |
| 5 | VWAP | Intraday context/bias |
| 6 | EMA | Trend confirmation |
| 7 | Risk Management | Survival — position sizing & stop-loss |
The single biggest mistake we see among new options traders is treating one indicator as a complete system. A lone RSI cross or a lone MACD crossover in a sideways market carries high false-signal risk. Stack a CPR level, a Price Action trigger, RSI reversal confirmation, and Volume participation together, and the same setup becomes dramatically higher probability — the core philosophy behind the CPR Brahmastra Strategy.
Theory is easy — reading a live chart is where most traders struggle. Here's an actual Nifty 50 · 5-minute chart showing CPR levels, 20 EMA, 200 EMA, VWAP, RSI with divergence, and Volume all working together on the same session:
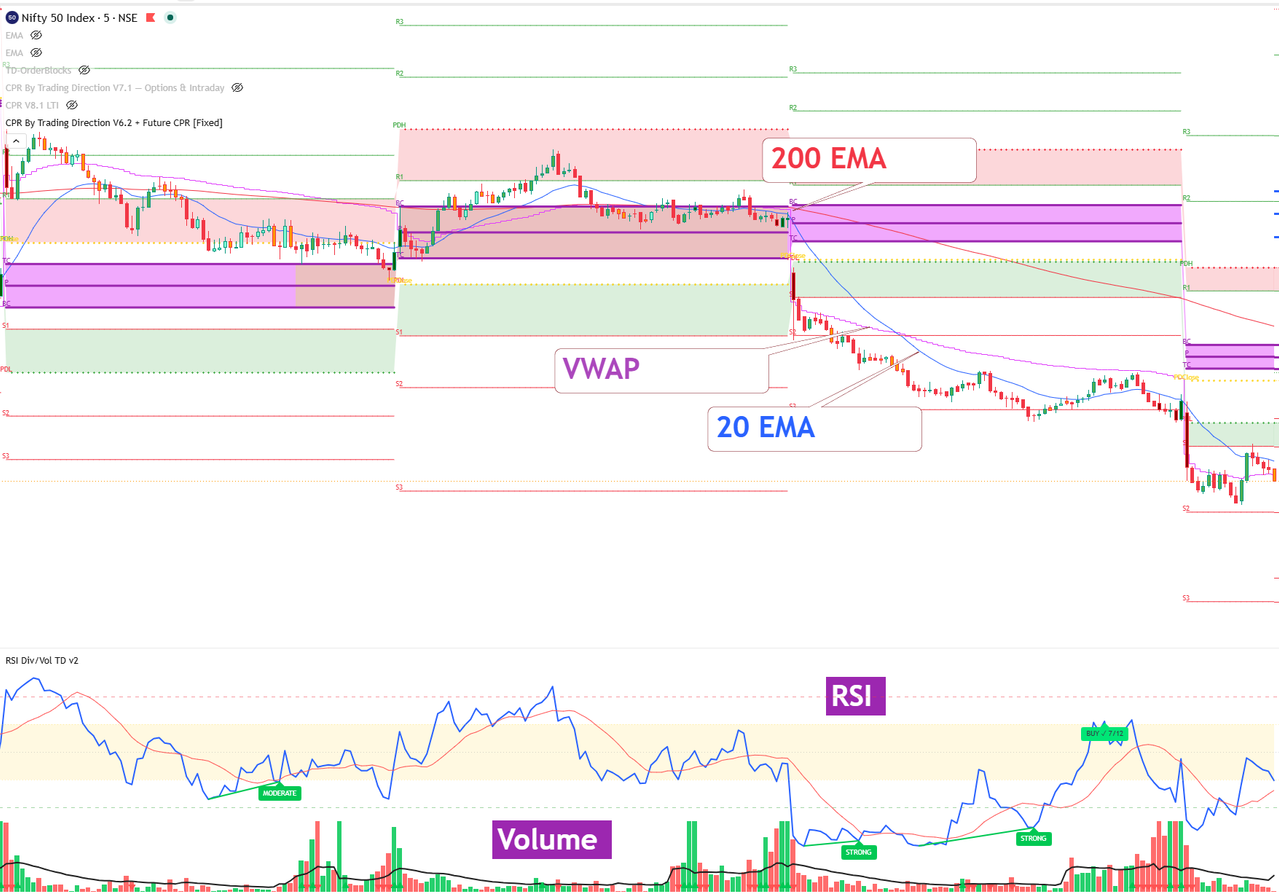
Walking through the read: price opens near the prior day's CPR, respects the R1–BC purple band as resistance for several candles, then a moderate RSI divergence forms as momentum weakens — exactly where a disciplined options seller would start tightening risk. Once price breaks below the CPR support zone with rising red volume, the 20 EMA rolls over and confirms the down move, while the 200 EMA (still sloping down from the left) keeps the larger bias bearish. Later, a strong RSI + Volume signal flags the next tradeable bounce — the same CPR + RSI + Volume + Price Action confluence taught in Section 8, applied live. This is the identical setup logic broken down candle-by-candle in the CPR Brahmastra BTST case study, and the indicator stack (CPR By Trading Direction + RSI Div/Vol TD) is the exact toolkit shared inside the CPR Brahmastra Strategy webinar.
Join the Sunday CPR Brahmastra live class and see CPR + Price Action + RSI + Volume confluence applied to real Nifty and Bank Nifty options setups.
No single indicator is "best" in isolation. CPR ranks highest overall because it's objective, works across almost every market condition, and gives a clear invalidation point — but it performs best when combined with Price Action, RSI, and Volume.
They serve different jobs. CPR gives pre-calculated levels for the entire day before the market opens, while VWAP is a running intraday average that's more useful as a real-time bias filter once the session is underway. Many traders use both together.
Both are lagging indicators — they confirm a move only after it has already started, which is costly when options premiums decay quickly. In sideways or range-bound sessions, this lag increases false signal risk significantly.
The 15-minute chart for overall direction, the 5-minute chart for setup formation and confirmation, and the 2-minute chart for a precise Price Action entry trigger — the exact funnel taught in the Trading Direction Sunday live class.
SMC (order blocks, liquidity, fair value gaps) is powerful but has a steep learning curve. Beginners are usually better served mastering a simpler, more objective system like CPR and Price Action first before layering in SMC concepts.
Disclaimer (English): This content is for educational purposes only and does not constitute investment advice. Trading in stocks, futures, and options is subject to market risk. Past performance of any strategy or indicator is not indicative of future results. Please consult a registered financial advisor before making any trading decisions.
अस्वीकरण (हिंदी): यह जानकारी केवल शैक्षणिक उद्देश्यों के लिए है और इसे निवेश सलाह नहीं माना जाना चाहिए। शेयर, फ्यूचर्स और ऑप्शंस ट्रेडिंग बाज़ार जोखिम के अधीन है। किसी भी रणनीति या इंडिकेटर का पिछला प्रदर्शन भविष्य के परिणामों की गारंटी नहीं देता। कृपया कोई भी ट्रेडिंग निर्णय लेने से पहले एक पंजीकृत वित्तीय सलाहकार से परामर्श करें।